Table of Contents
This interface is deprecated, please use Muon Analysis instead.
This interface is used to analyse the data collected on Muon instruments. The interface can be accessed from the main menu of MantidPlot, in Interfaces → Muon → Muon Analysis old. For sample datasets, please visit Muon - Downloads.#
If the Frequency Domain Analysis interfaces is opened it will import all of the data available for the current run in Muon Analysis. This will include any custom groupings/pairs.
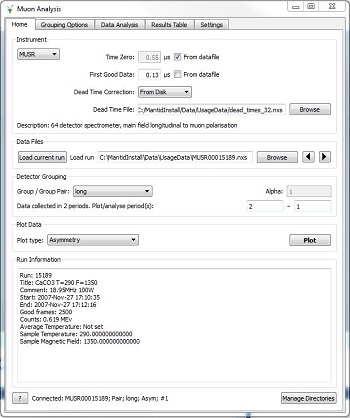
The Home tab is the MuonAnalysis entry-point. It allows you to load the data, set some basic loading and plotting parameters and plot the data.
In most cases, the initial settings should be fine and the grouping loaded from the data file should be sensible, but these can be easily adjusted using the GroupingOptions and Settings tabs.
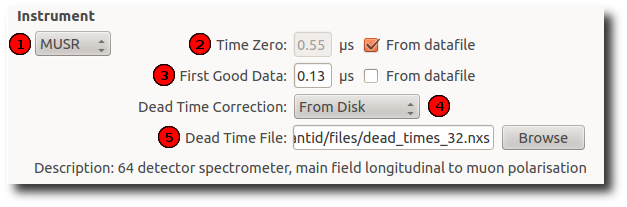
| 1 | Instrument | Selection of instrument that the experiments were run on. It is an advantage if an Instrument Definition File (IDF) is available for the instrument selection. |
| 2 | Time Zero | Time zero value ( ). Any bins before that time will be discarded.
If From datafile is checked, the value stored in the loaded Muon data file is used. ). Any bins before that time will be discarded.
If From datafile is checked, the value stored in the loaded Muon data file is used. |
| 3 | First Good Data | Time of the first good data (). If Time Axis is set appropriately on the
Settings tab then it is used as a
start value for the X-axis. If From datafile is checked, the value stored in the
loaded Muon data file is used. |
| 4 | Dead Time Correction | The type of Dead Time Correction to apply to the loaded file. Available choices:
|
| 5 | Dead Time File | If Dead Time Correction is set to From Disk, you can choose a Nexus file which contains a table with Dead Times, and will be applied to the loaded data file. |
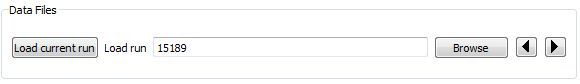
| 1 | Load current run | Attempt to load current run for the instrument specified (ISIS only) |
| 2 | Load current run | Specify a data file by typing a run number (for the instrument selected from the Instrument drop-down) or use the Browse button to select a data file. Multiple runs/files can be specified here, in which case they will all be summed to form a single data set. Files should be in the NeXus format (PSI bin files can be converted using the program any2many). Both version 1 and 2 of the muon NeXus data format are supported. |
| 3 | Previous/next run | Open next or previous run in the series. |
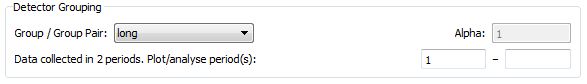
| 1 | Group/ Group Pair | A group or a pair which will be plotted. |
| 2 | Alpha | This text box is only visible if a pair is selected. It corresponds to the pair alpha value used for asymmetry calculation. See AsymmetryCalc for a broader explanation. The value is taken from the Pair table on the Grouping Options tab for the selected pair and can be modified there only. |
| 3 | Periods | Use the two text boxes to select the combination of periods you would like to plot. Each holds a comma-separated list of periods, and the periods in the list on the right will be subtracted from those on the left. For example, to plot the combination (1+2)-(3+4), enter “1,2” in the left-hand box and “3,4” in the right hand box. For single period data only the first box will be active. |
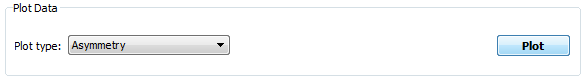
| 1 | Plot Type | Type of the plot. Available choices are:
|
| 2 | Plot | Plots the loaded data using the parameters set. |
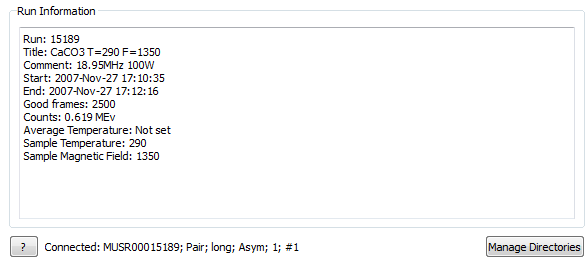
| 1 | Run Information | Information about the loaded run. See Run for the list of parameters which are looked up in the data files. |
| 2 | Connected plot | The name of the workspace produced for the last plot, i.e. “connected” to the interface. It will be used for fitting etc. |
| 3 | Manage Directories | Opens the ManageUserDirectories dialog. |
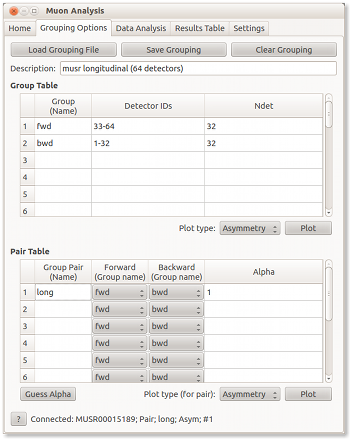
The Grouping Options tab allows you to set up detector grouping, which will be applied to the loaded data.
There are two concepts we use when dealing with detector grouping of Muon instruments:
Essentially, this tab allows you to create/modify groups and form pairs out of them. There are basic load/save functions for using predefined instrument groupings and for saving custom ones. Predefined instrument groupings are usually stored in the Instrument/Grouping directory of the Mantid install directory.
This tab also provides some basic plotting functionality, which allows you to experiment with groupings and plot the results without any additional effort.
| 1 | Load Grouping File | Opens a file browser window. Use it to select a grouping file for loading. |
| 2 | Save Grouping | Opens a file browser window. Use it to select a file to save a grouping to. |
| 3 | Clear Grouping | Clear group and pair tables. |
| 4 | Description | Description of the current grouping. Is loaded/saved together with the grouping information. |
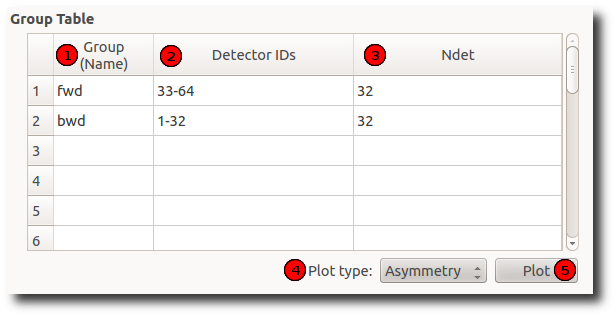
| 1 | Group (Name) column | The name of the group. Should be unique. |
| 2 | Detector IDs column | A list of detectors associated with the group. One detector might be in multiple groups. Ranges are allowed, e.g. “1,2-5,7-9,11” represents detectors with IDs 1,2,3,4,5,7,8,9 and 11 |
| 3 | Ndet column | Number of detectors associated with the group. This column is not editable and is updated automatically when the list of group detectors changes. |
| 4 | Plot type | What kind of plot to produce when Plot button is pressed. See the Home page for an explanation of available plot types. |
| 5 | Plot | Plots the group highlighted most recently. |
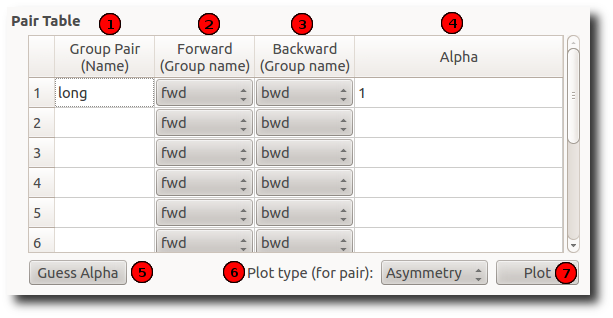
| 1 | Group Pair (Name) column | Name of the pair. Should be unique. |
| 2 | Forward (Group name) column | The first (“forward”) group of the pair. |
| 3 | Backward (Group name) column | The second (“backward”) group of the pair. |
| 4 | Alpha column | Alpha value of the pair. |
| 5 | Guess alpha | Guess a new alpha value for the pair highlighted most recently. Uses AlphaCalc (AlphaCalc) to do that. |
| 6 | Plot Type | What kind of plot to produce when the Plot button is pressed. See the Home page for an explanation of available plot types. |
| 7 | Plot | Plots the pair highlighted most recently |
This tab is designed for the user to make a fit against the data just plotted. Since Mantid 3.8 (upgraded in 3.10), this tab has been enhanced to include fits of multiple datasets at once. Since Mantid 3.10 a Transverse field (TF) Asymmetry mode has been added and from Mantid 3.11 it is also available in multiple fitting mode.
By default, multiple dataset fitting is not enabled and the interface will look just as it did pre-Mantid 3.8.
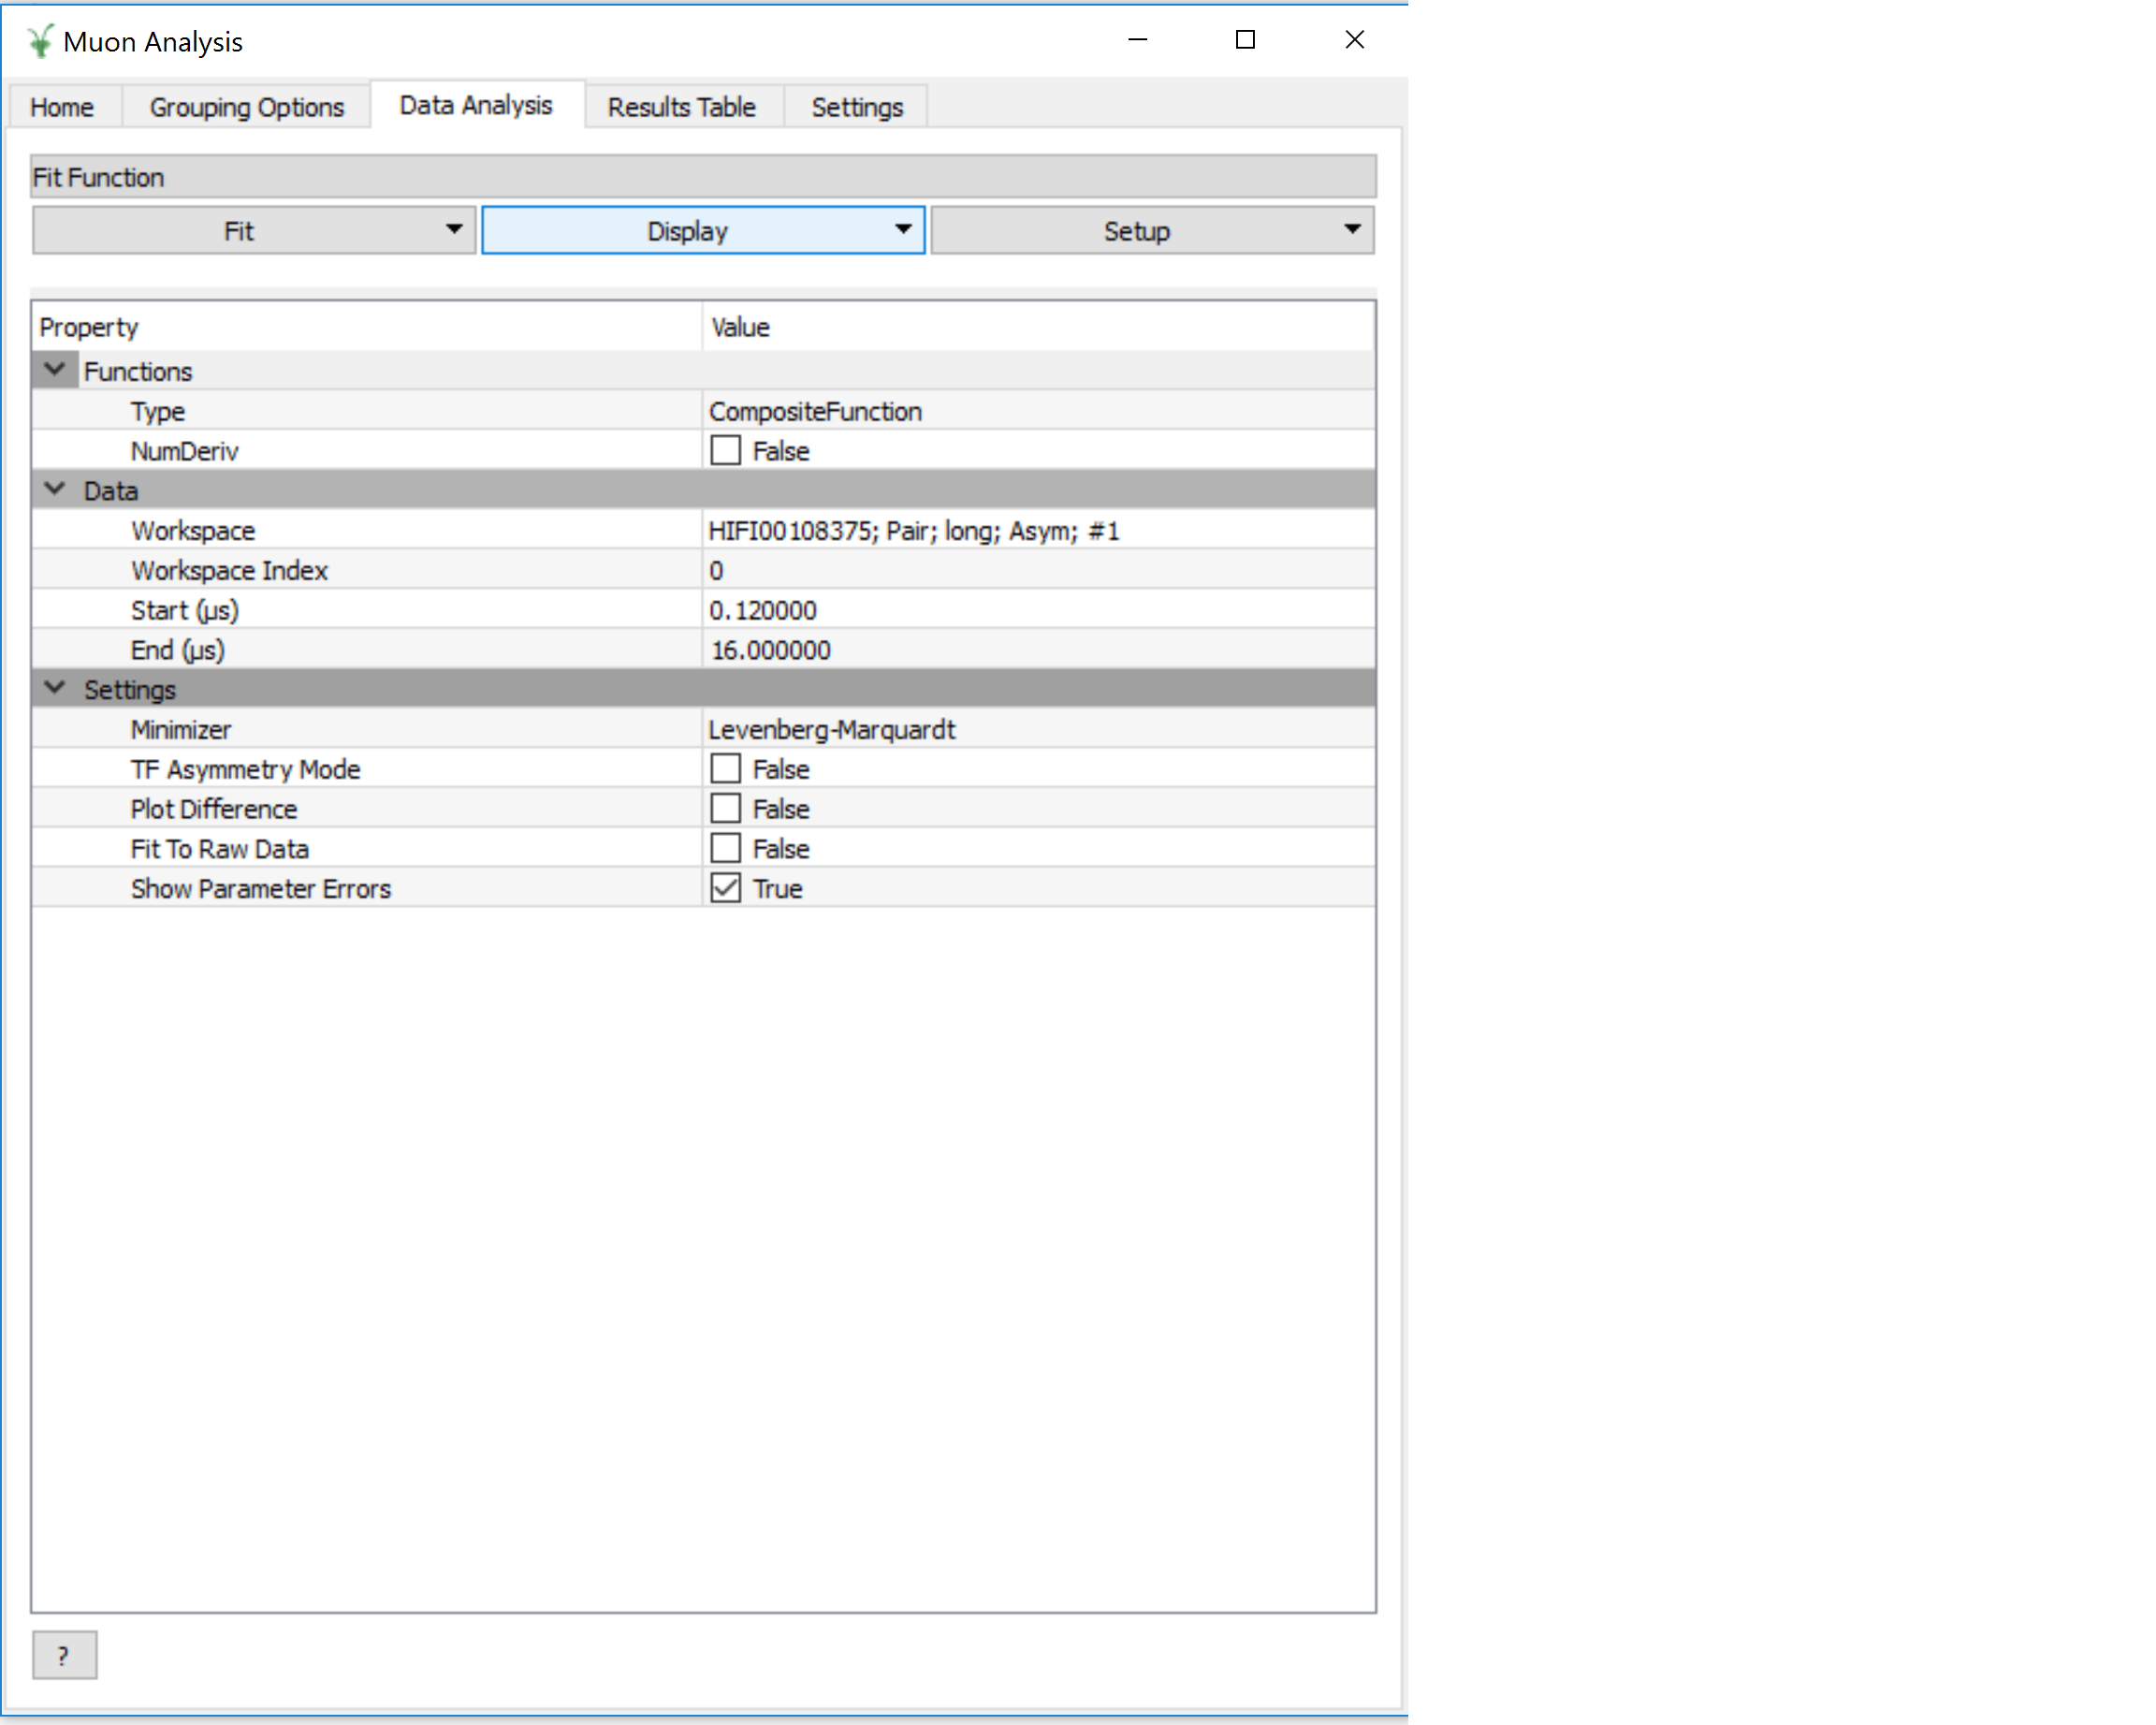
In this case, the only thing that this tab will contain is a specialised version of the Fit Property Browser. When the tab is open, this fit property browser is used by default within MantidPlot.
Note that, in this mode, simultaneous fits are not possible. The intention is that this mode could be useful for users who are accustomed to the existing UI, or if a bug is found in the new UI.
The TF asymmetry mode can be enabled by checking the “TF Asymmetry” checkbox in the Settings table of the data analysis tab. Leaving the tab will deactivate TF asymmetry. When TF Asymmetry is activated the user’s function is updated by using ConvertFitFunctionForMuonTFAsymmetry and populates the function browser. The ties and constraints are not preserved. The plot will also update. Running a fit will then use CalculaterMuonAsymmetry. This willupdate the normalized data. It is advised that when using this feature to have no binning.
When the user deactivates the “TF Asymmetry” checkbox the user function is returned with updated values.
The multiple fitting functionality can be enabled by checking the “Enable multiple fitting” checkbox on the Settings tab. When this is activated, the tab is divided into multiple sections vertically.
The uppermost of the three vertical sections is the Fit Function section, which is a FunctionBrowser just like in the General/Multi dataset fitting interface (and numerous other places in Mantid). Functions can be added by right-clicking. If more space is needed, this section can be expanded by dragging its lower edge downwards.
The function browser has three columns - property, value and global. The values shown are those of the currently selected/plotted dataset. The global column contains a checkbox for each function parameter which, when checked, sets this parameter to be shared between all fits.
Parameters can be fixed, tied and constrained by right-clicking. In addition, just as in the general multi dataset fitting interface, when highlighting a non-global function parameter, a small button will appear next to its value. This button will open the “Edit local parameter values” dialog, which offers greater control of function parameters for each dataset.
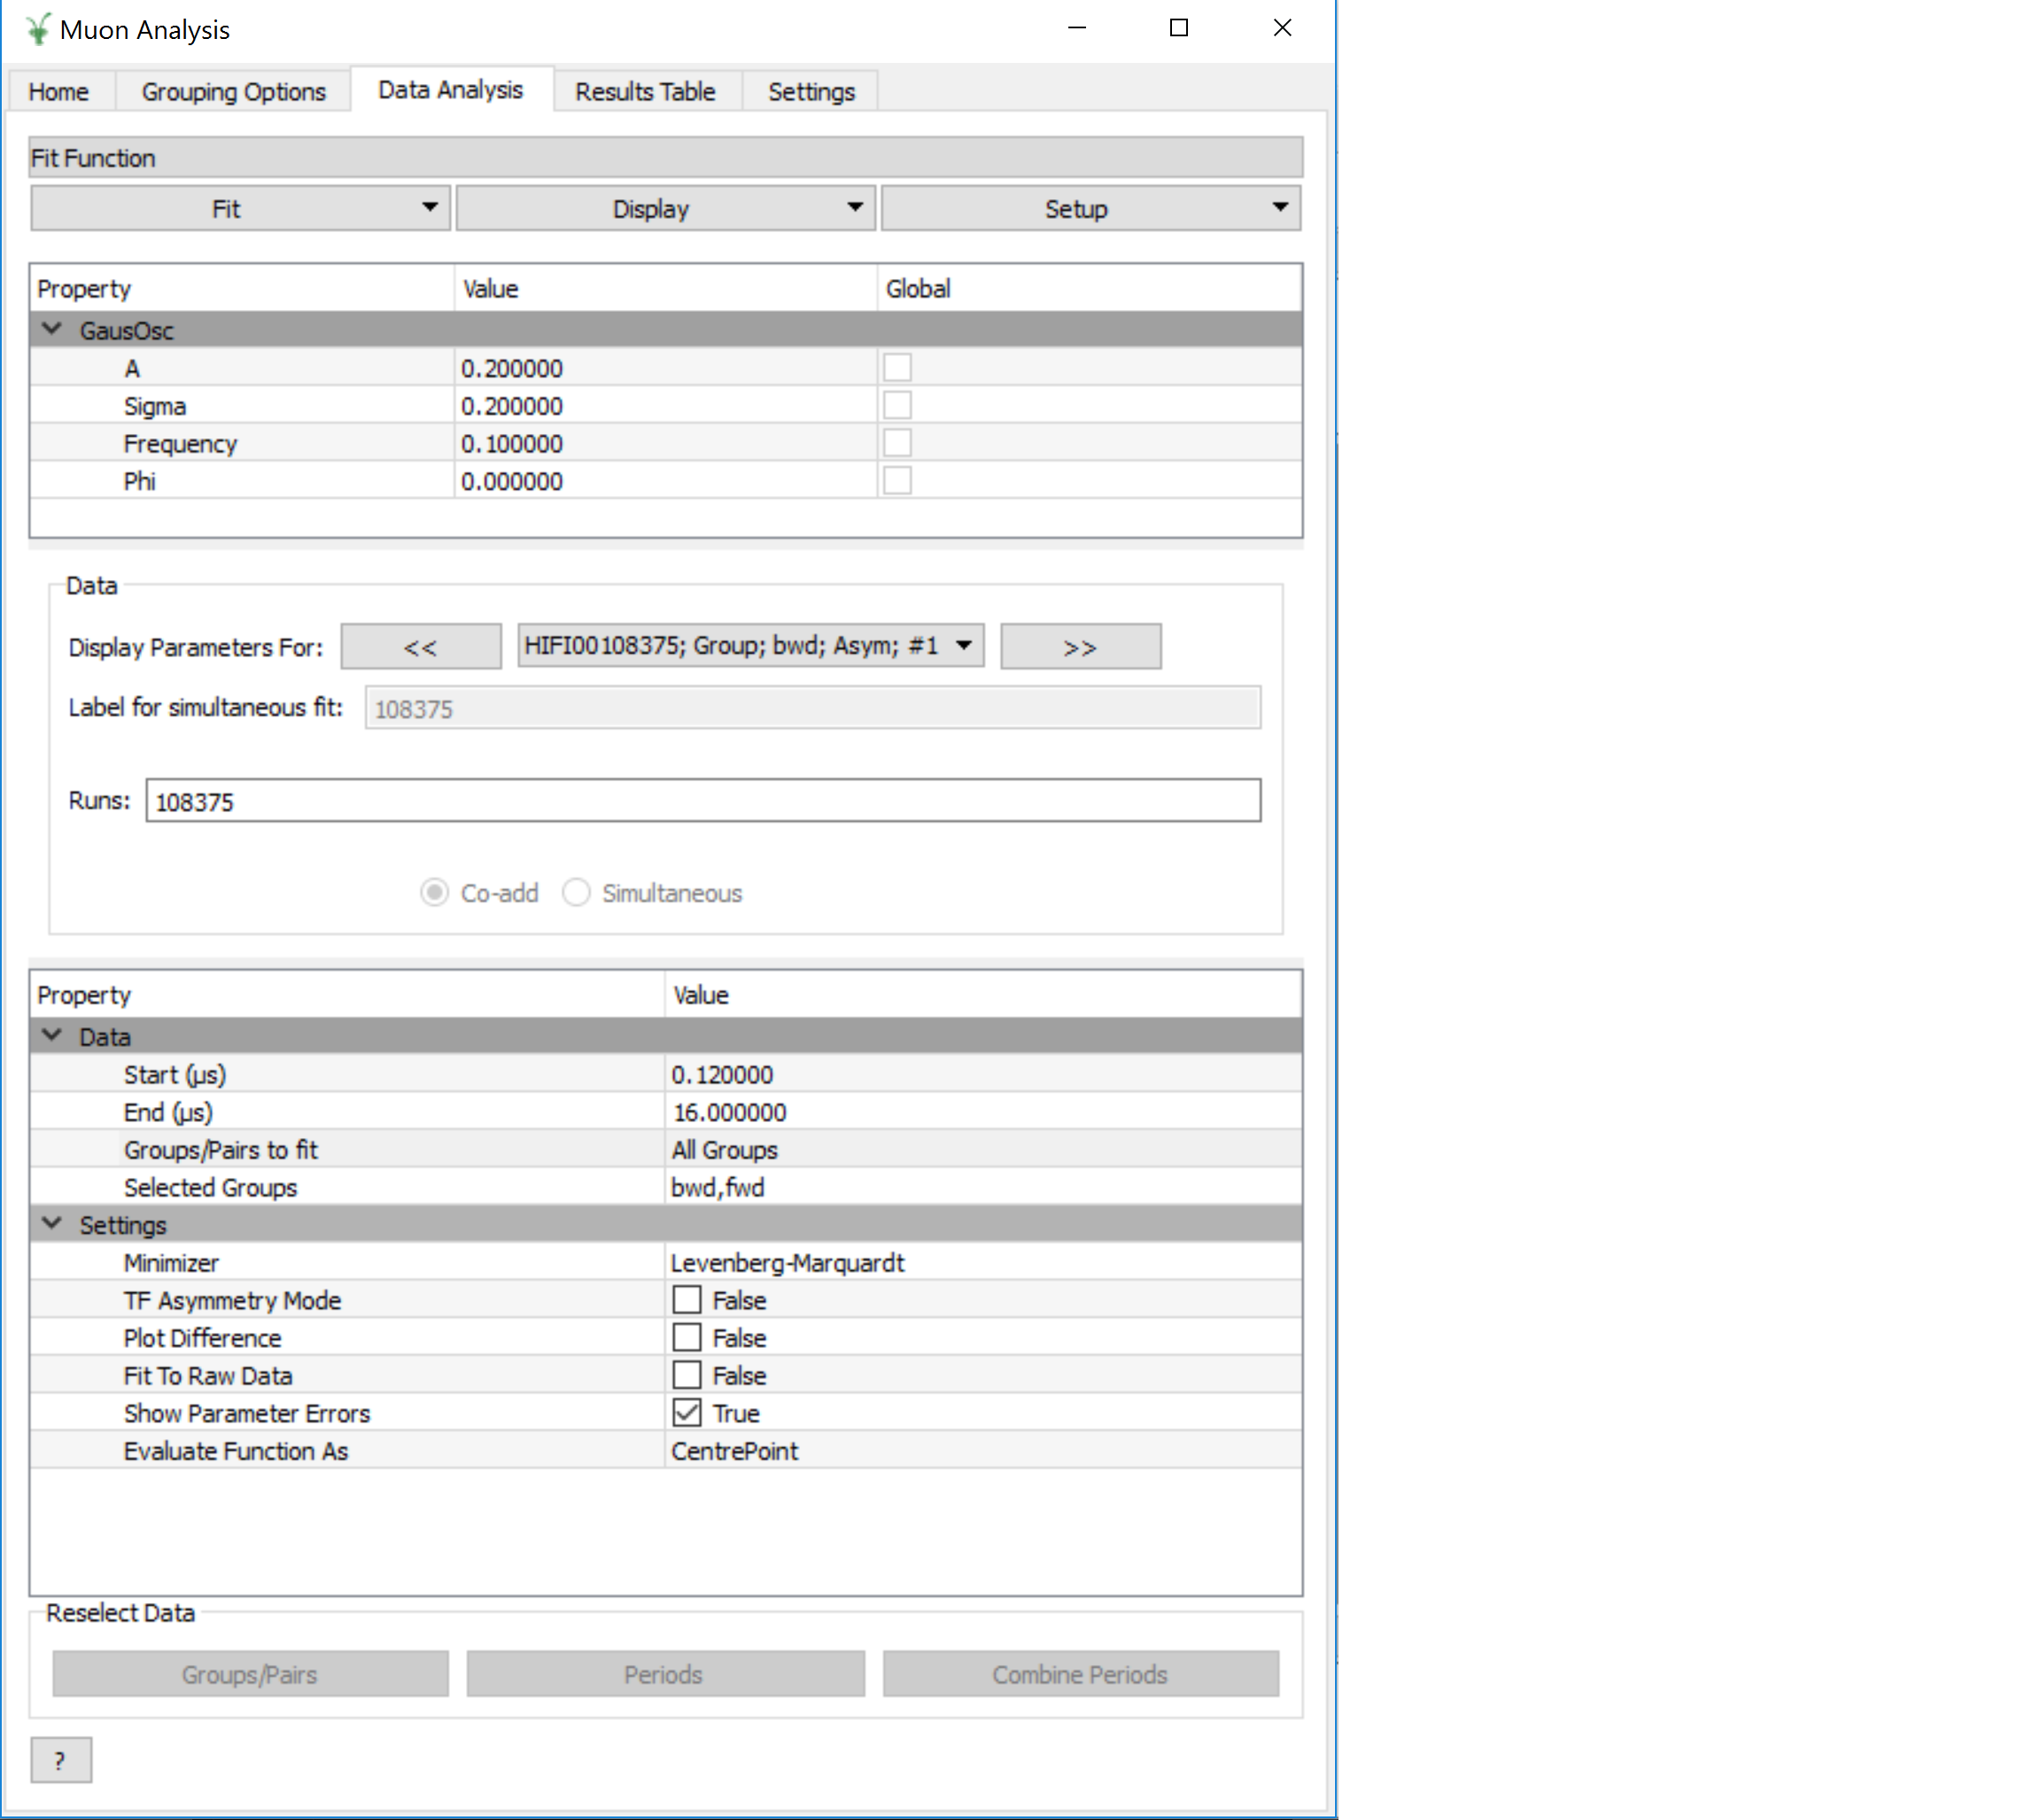
The next section of the tab is the data selector, which controls the dataset(s) that will be fitted. By default, this will be a single dataset, the same as the data loaded on the Home tab. The dataset(s) can be changed here and, if more than one is selected, they will all be fitted simultaneously.
The “Display Parameters For” boxes consist of a backwards button, a drop-down selection and a forward button. The drop-down list shows all datasets currently selected, and the left and right buttons cycle through them. The currently selected dataset has its parameters shown in the Fit Function (upper) widget, and will be plotted.
For a multi-dataset fit, the “Label” box is enabled. This allows the user to input a label for the simultaneous fit.
The data table allows the user to modify the selected data for the fitting. This includes the start and end times, which can also be updated by dragging the blue dashed lines in the plot. The “Groups/Pairs to fit” box provides a drop-down menu with three options (all groups, all pairs and custom). Selecting custom will produce a pop-up box with tick boxes for each of the available groups and pairs. If a user wants to update the custom selection the Groups/Pairs button can be pressed from the ReselectData section at the bottom of the tab (this is only enabled if a custom selection is set). Underneath displays the “Selected Groups”.
The next row is the “Periods to fit” option, which is only displayed for multiple period data. This will automatically be populated with each of the periods (e.g. 1,2,3) and a custom option. Selecting custom will produce a pop-up with checkboxes for all of the periods. Selecting custom will also enable the “Periods” button in the ReselectData section and pressing this button will allow the user to alter their custom selection.
Near the bottom of the tab contains selected fit options that can be adjusted, just as elsewhere in Mantid. The only option specific to the Muon Analysis interface is Fit To Raw Data. When this option is set to True, the fitting process is done using the raw (unbinned) data, even if the DataBinning is set.
At the bottom of the tab is the “Reselect Data” section. This includes three buttons “Groups/Pairs”, “Periods” and “Combine Periods”. The “Groups/Pairs” and “Periods” buttons are only when the relevant options in the data table are set to custom. Pressing the button will produce a pop-up that will allow the user to modify their selection.
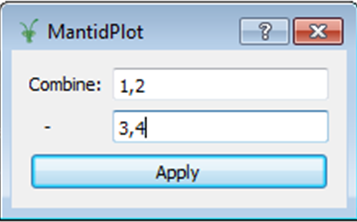
The “Combine Periods” button is only enabled if multiple periods are available. Pressing the button will generate a pop-up with two boxes. The top one is for adding periods (as a comma separated list or with “+”) and the bottom box is for subtraction (as a comma sepearted list). Everything in the top and bottom boxes are summed seperatley and the results are then used in the subtraction.
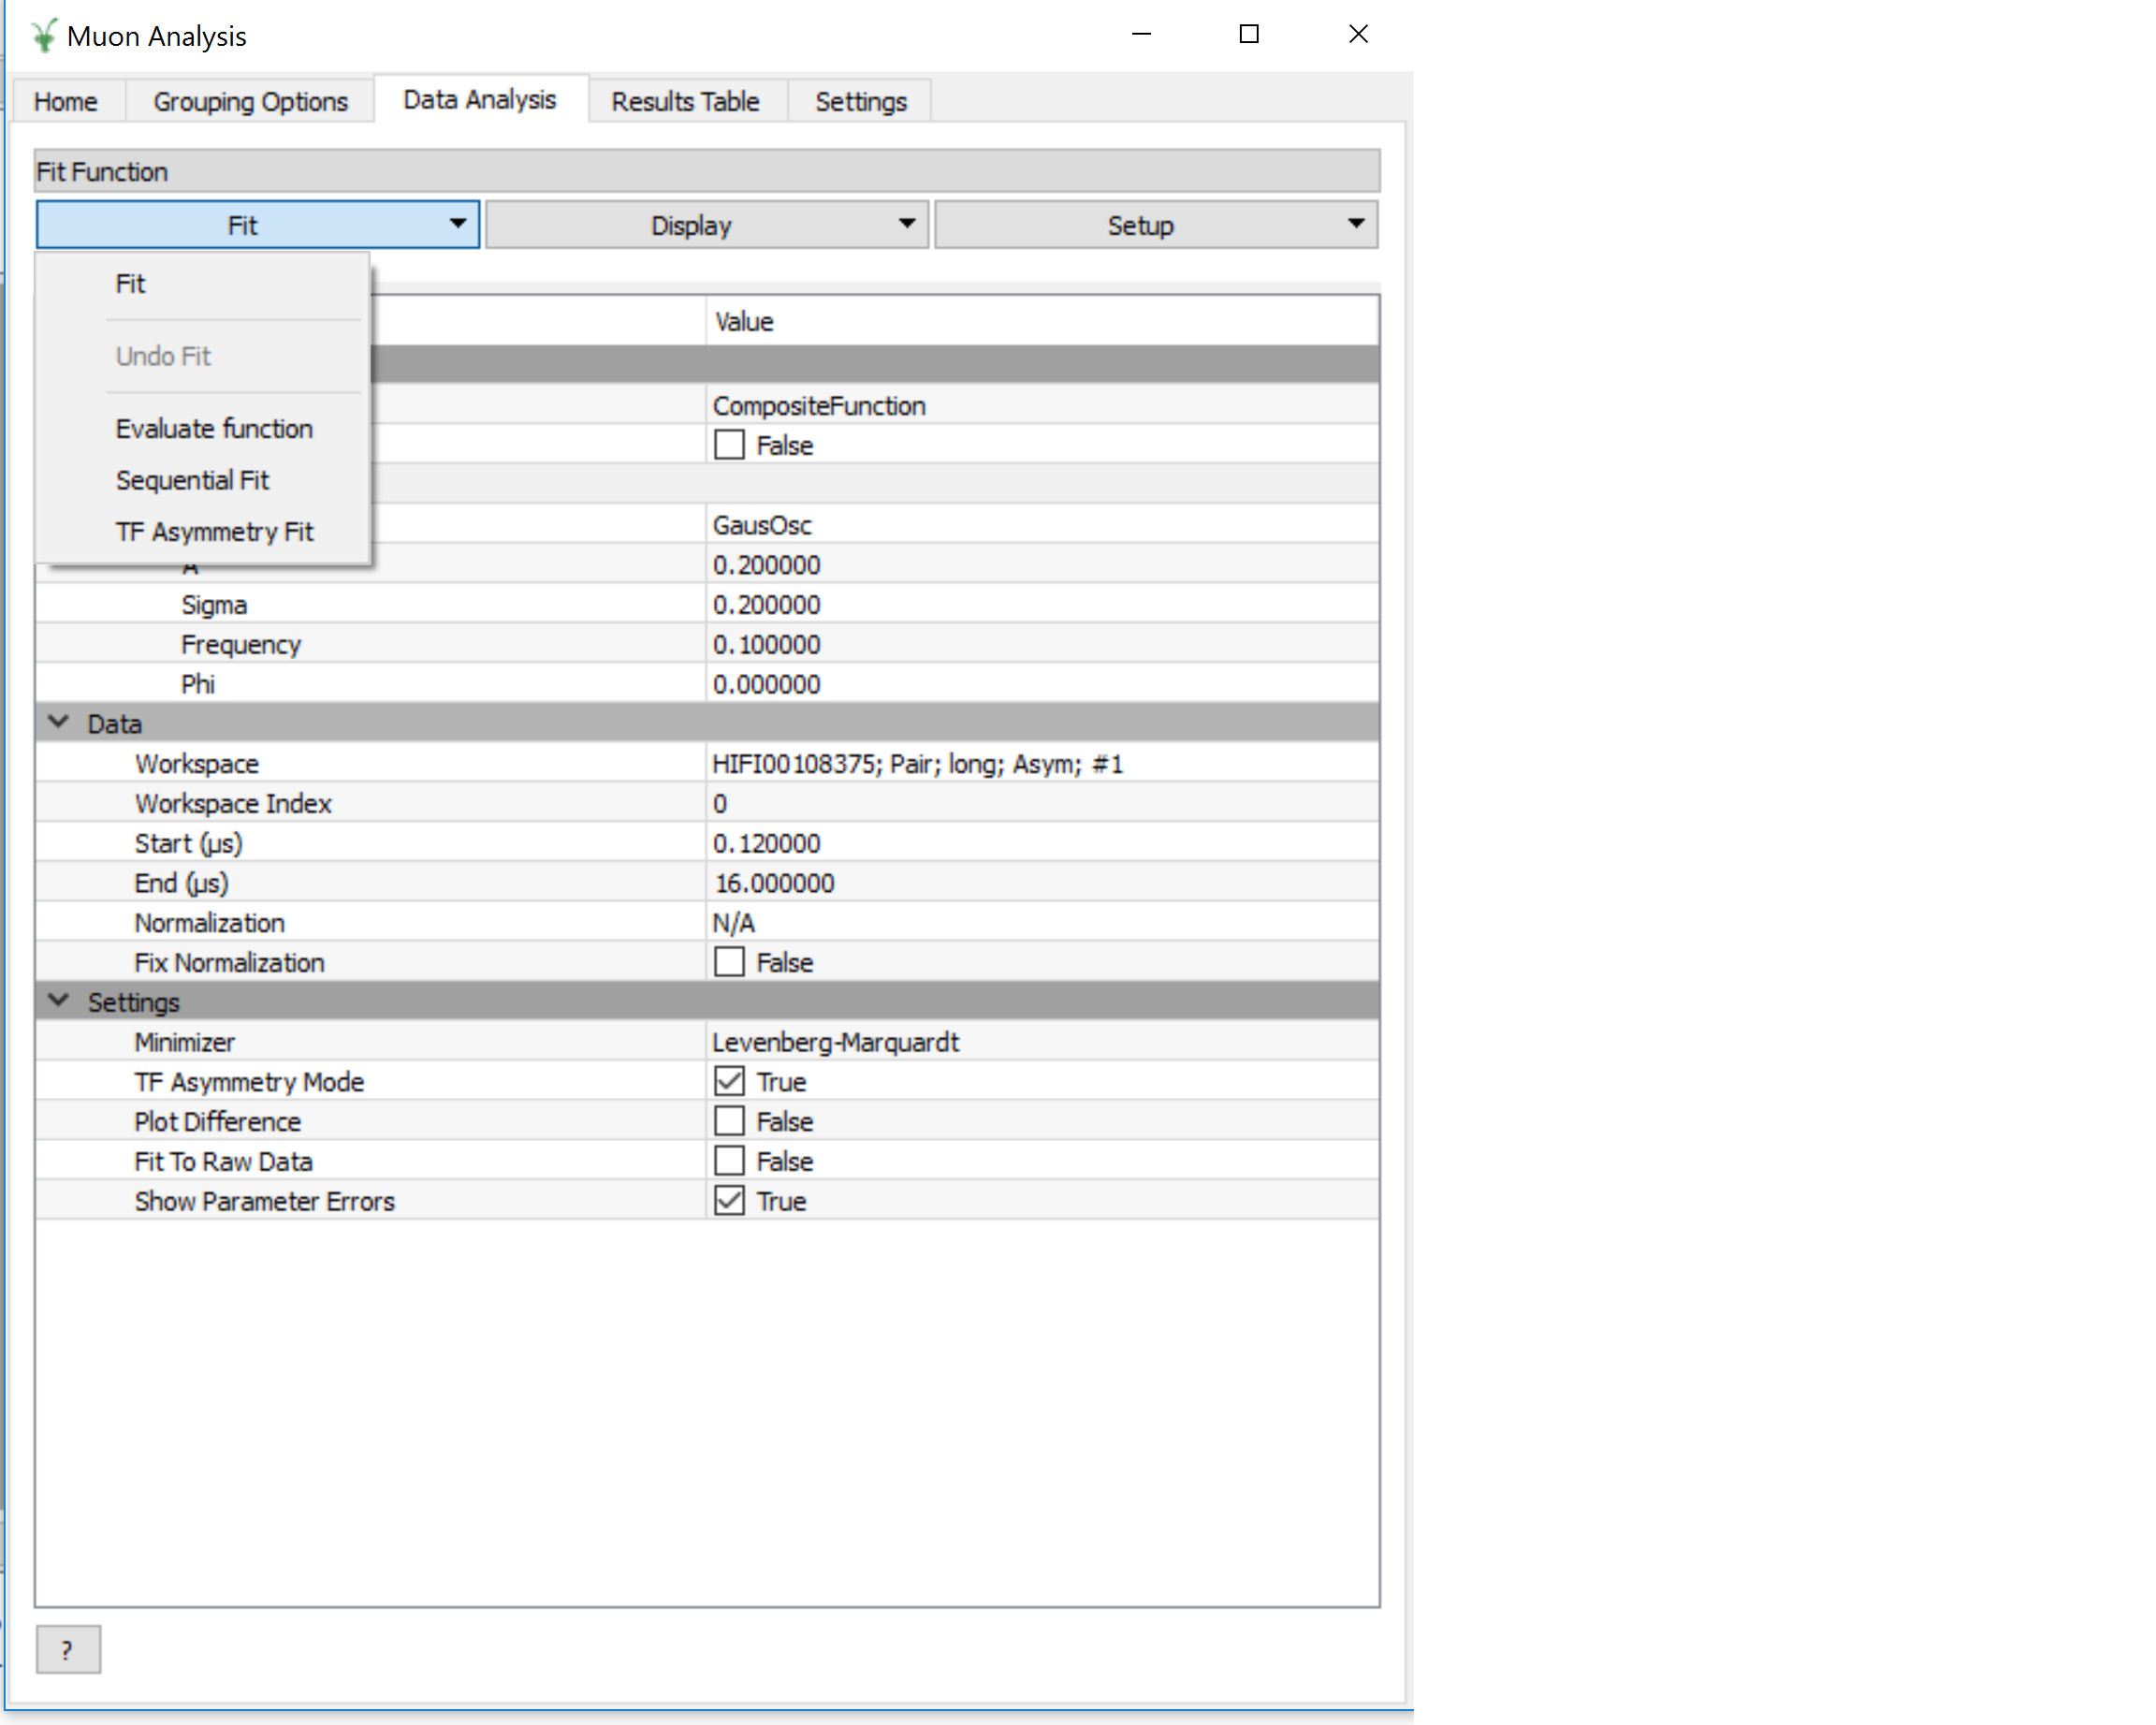
In MantidPlot 3.1 a specialized sequential fitting dialog for MuonAnalysis was introduced. It allows users to fit various data sets to the chosen fit model, applying all of the interface settings.

The dialog can be opened from the Fit menu in Fit → Sequential Fit.
| 1 | Runs | A list of run data files to fit. Two types of input are accepted:
|
| 2 | Label | Text label to use for the sequential fit. It is used to find the results on the ResultsTable tab. The resulting workspace group and the fit-result workspaces will have the label in their names. |
| 3 | Parameters | This option specifies the initial fit parameters for every fit. Choices should be self-explanatory. |
| 4 | Progress | Shows the progress of the fit. |
| 5 | Start/stop button | Starts a new fit or stops the current one. |
| 6 | Diagnosis table | Displays the intermediate results of the fit. This includes run number, fit quality (see OutputChi2overDoF in Fit) and fitted values of all the parameters. |
After the options have been set and the Start button has been pressed, the dialog goes through every data file and does the following:
After that’s done, you can retrieve the results in two ways:
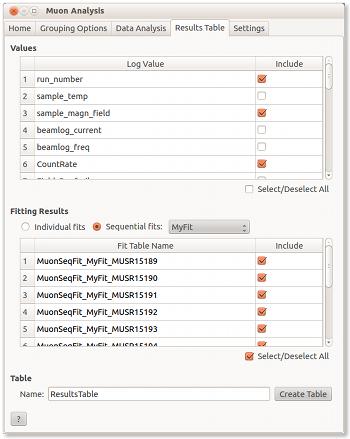
This tab allows users to export the fitting results alongside log values as a table.
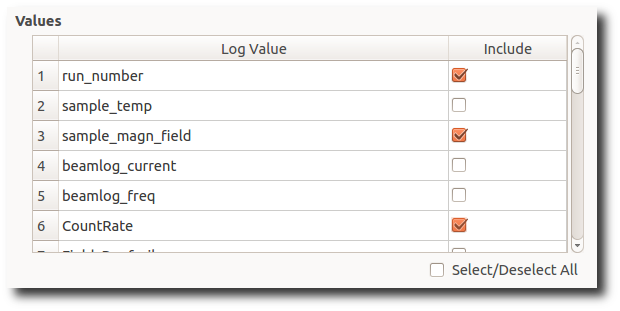
The table contains a list of log values present in all of the workspaces in the Fitting results table. The ones selected will be included in the results table.
In the case of start and end times (run_start and run_end), the option is given to write these either as text or number. The text option gives an ISO- formatted string (eg. 2016-07-06T10:10:34) and the numeric option gives the time as a number of seconds. Zero seconds is taken as the start time of the first run in the selected set.
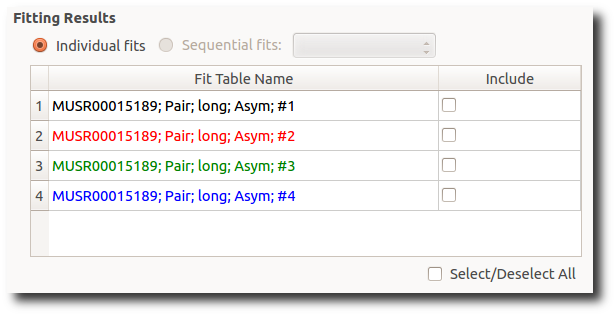
This table contains a list of fitted workspaces. You can choose whether you want to see individual fits only, or a specific sequential (see SequentialFitting ) or simultaneous (see DataAnalysis) fit label.
Fitted parameters of the selected workspaces will be added to the results table.
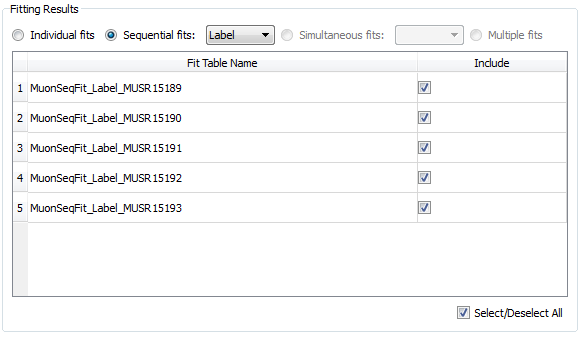
Workspaces might be coloured differently. Workspaces of different colours have different fitting models and therefore couldn’t be included in the same Results table. (If looking at simultaneous fits, different colours could also indicate that the fits had different numbers of datasets).
As well as selecting workspaces, the fourth radio button - “Multiple” - can be used to create a table of multiple simultaneous fits, one row per label. In such a table, each global parameter gets one column and local parameters get one column per dataset.
This tab allows users to specify various plotting style options, loaded data binning and other general options.
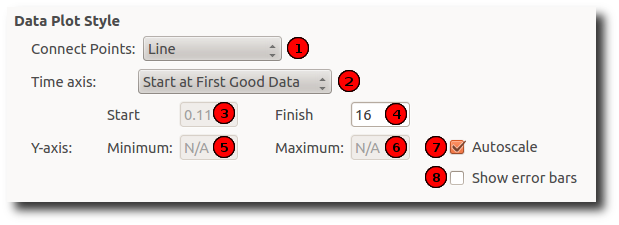
These options control the style of the plot. They will be applied to all new plots. The currently connected plot (if any) is updated as well.
| 1 | Connect Points | Option for how the points will be represented on the plot:
|
| 2 | Time axis | Type of the start value of the X-axis:
|
| 3 | Start | First value of the X-axis (). |
| 4 | Finish | Last value of the X-axis (). If empty, the last
available value is used. |
| 5 | Minimum | Minimum value on the Y-axis. If empty, is determined automatically. |
| 6 | Maximum | Maximum value on the Y-axis. If empty, is determined automatically. |
| 7 | Autoscale | If checked, the values of Minimum and Maximum are determined automatically based on the max/min values of the data. |
| 8 | Show error bars | If checked, the curves will have error bars attached to them. |
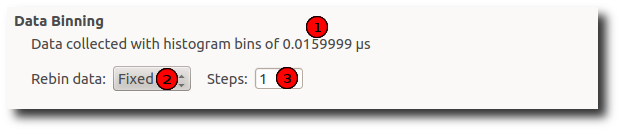
| 1 | Bin size | Display the size of the bin in the currently loaded data. This
is usually 0.016 for Muon instruments. |
| 2 | Binning type | What type of binning is applied to the loaded data:
|
| 3 | Binning parameters |
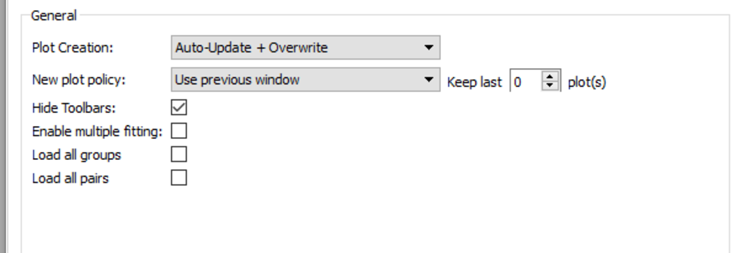
| 1 | Plot Creation |
|
| 2 | New plot policy |
|
| 3 | Hide Toolbars | If enabled, opening the interface up hides the MantidPlot toolbars. This is useful on smaller screens. |
| 4 | Enable multiple fitting | By default, this option is disabled and the DataAnalysis tab will look the same as it did in previous versions of Mantid (pre-3.8). Note that simultaneous fits are not possible in this case. Enabling the option will change the UI of the DataAnalysis tab to the new one described above, enabling fits of multiple datasets to be made. |
| 5 | Load all groups | By default, this option is disabled and the workspaces are generated when they are plotted. Enabling the option will automatically add workspaces for each group to the grouped workspace. If a new group is created it will be added to the grouped workspace. |
| 5 | Load all pairs | By default, this option is disabled and the workspaces are generated when they are plotted. Enabling the option will automatically add workspaces for each pair to the grouped workspace. If a new pair is created it will be added to the grouped workspace. |
If you have any questions or comments about this interface or this help page, please contact the Mantid team or the Muon group.
Categories: Interfaces | Muon